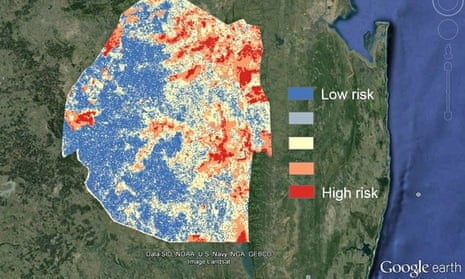
A team of epidemiologists working on malaria elimination from the Global Health Group at the University of California, San Francisco are developing an automated risk map that aims to predict future outbreaks of malaria. “You can actually generate a statistical model that predicts the likelihood of malaria at any given location, based on the environment,” says Hugh Sturrock, assistant professor of epidemiology and biostatistics at UCSF.
Latest estimates show that malaria currently affects more than 200 million people around the world, with the majority in developing countries. This new open platform tool could allow malaria control programs to map the locations of malaria cases and predict which other areas may be at risk of future outbreaks.
So, what is a risk map?
A risk map is a data visualisation tool that takes into account different variables and tries to establish a relationship between them.
What does this risk map do?
The map can record cases of malaria, where they occurred, as well as the environmental and climate conditions in that place. Environmental factors the map considers include temperature, rainfall, elevation, vegetation, proximity to water bodies and others, down to one-square kilometre. Using statistical models, this information can be combined to produce a risk map.
Are risk maps not used already?
Yes, but they are often outdated, static, and creating them is not a quick process. “We want to make real-time dynamic maps so that every time a new case comes in, it updates and you can have the most up-to-date risk map possible,” says Sturrock.
How does the map predict where malaria cases might occur?
The next step is to look at the relationship between malaria cases and the environmental factors at that location. Once that relationship is established, it will be possible to predict the probability of finding another case of malaria in a location with similar conditions.
“It might be that you find a case of malaria in a low and wet area, so you can say: ‘What other low and wet areas are likely to have malaria?’” explains Sturrock.
The map will also hope to monitor these relationships over time. When it rains, it takes time for the water to rise to sufficient levels, and for mosquitos to come and lay eggs – so there is a time lag between rain and seeing malaria cases. “With the map we can say that if it’s raining today it means the probability of malaria in a month or two month’s time is quite high,” says Sturrock.
How accurate is it?
The accuracy will be determined by the quality of the data being inputted. “We have really good satellite information on vegetation, rainfall, temperature and things like that,” says Sturrock. “What we have less control over, but what is incredibly important, is the case data
“You need a good disease surveillance programme to be recording cases and locating them back to a village (or even a house), for this to be really accurate and successful.”
How will aid workers use the map?
Firstly, they will be able to record malaria cases by uploading case information (such as number of patients and their locations) onto the open platform, and use it to make a risk map online, which can be saved or downloaded.
Practitioners can also use the map to target resources more effectively by looking at existing risks.
“If you have a good understanding of malaria; where it is and where it is likely to be, then you can target it and use your resources more effectively,” says Sturrock. “You don’t have to give out bed nets to everyone in the country, and you don’t have to treat people everywhere. That ultimately leads to costs savings and is a more effective way to control the disease.”
The map will also help to prioritise individuals when following up cases. Sturrock explains: “You could say, ‘we’re not going to follow this person up now because they live in a very low-risk area. But this other person we will follow up because they live in a very high risk area.’”
Will anybody be able to submit data?
“It won’t go straight to being an open platform,” says Sturrock. “We want to make sure that it’s not abused, because it will produce results. We need some way of validating the maps to make sure that the platform is doing its job.”
How much will it cost?
The map will be a free, open-source platform.
Is it ready to be used in the field?
Not yet. The team are working with Google Earth Engine to create a much faster procedure for creating the maps. They hope to have a prototype ready by early 2015, in time for the next Asia-Pacific Malaria Elimination Network meeting.
Sturrock says: “My hope is that by this time next year we’ll have a much better, fully-functional system up and running - certainly in Swaziland - and be thinking about how to open this up elsewhere.”
Read more stories like this:
Can maps and mobiles prevent blindness?
War on the ‘Malaria mayhem’ in Mumbai reduces infection by 80%
Advertisement feature: The dawn of a new era for malaria elimination
Join our community of development professionals and humanitarians. Follow @GuardianGDP on Twitter.

Comments (…)
Sign in or create your Guardian account to join the discussion